• Home
  • About Us
    • JoinCalifornia
    • Use as a Reference
  • Political History
    • 2021 Senate to Assembly District Table
    • Term Limits in California
    • Legislative Committee Reports
    • Notable No Votes
    • Redistricting
    • Scott Lay’s Sofa Degree
    • Legislative Staff
  • Nelson S. Dilworth Collection
    • California’s Military History
  • Leroy F. Greene Collection
  • Covering the Capitol
  • Article Topics
    • Top Stories
    • 2014 Election
    • 2012 Election
    • Current Research
    • Constitutional Officers
    • Congress
    • State Senate
    • State Assembly
    • Deaths

One Voter Project

The Online Home of California's Political History

September 28, 2015 By Alex Vassar Leave a Comment

Facts and Statistics 2015 Released

Arthur Ohnimus
California Legislature

It started out with a simple enough question; “How many people have served in the California State Legislature?”

While it seems like it would be easy enough to answer (after all, the identities of state legislators is hardly a secret), the answer took some time to find. As it turned out, the weeks it took to find that answer made it much easier to find a flood of other answers about that part of state history.

Finding out how many people served in the California Legislature required knowing

  • A) How many people served in the Senate,
  • B) How many people served in the Assembly, and
  • C) How many people served in both.

After a lot of research to identify different people with similar names (sometimes fathers and sons, sometimes people who weren’t related) and people listed with different names in the two houses (like Assemblywoman Elaine W. Alquist and Senator Elaine K. Alquist), we had a pretty solid place to start.

The database was later expanded to include what house legislators served in during each session, their political affiliation, gender, and which term limits law they fell under.

The end result was the legislative facts and statistics booklet available at the link below.

It includes; the longest serving legislators, the longest gaps in service, how many years of prior legislative experience the members of different sessions had, and the legislators elected with the most and fewest votes in the past 15 years.
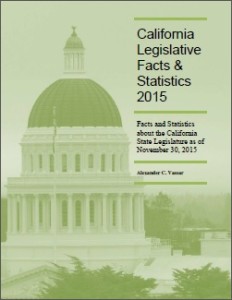
2015 Facts & StatsLegislative Facts and Statistics, 2015 Edition


Filed Under: Current Research, From the Archive, JoinCalifornia, Special Elections, State Assembly, State Senate, Term Limits, Top Stories

Leave a Reply

You must be logged in to post a comment.

This site uses Akismet to reduce spam. Learn how your comment data is processed.

Recent News

What Happened in the 2022 Election

November 13, 2022

[Updated 12/12] That was interesting. An election season that roared by in … [Read More...]

Running Unopposed in 2022

March 26, 2022

The California State Capitol According the Notice to Candidates, issued by … [Read More...]

Dilworth Video

October 8, 2021

An introduction to the story of State Senator Nelson Dilworth and the amazing … [Read More...]

NEW BOOK: California Lawmaker 2021

February 12, 2021

From confrontations in the tense years before the Civil War to the recent work … [Read More...]

Women in Statewide Office

January 29, 2021

As an update to a post from 2018, which noted that three was the highest number … [Read More...]

Latest Tweets

  • Just now
  • More Tweets by Alex Vassar

Fun Fact

The only Democrats to serve as Governor of California since the end of World War II were; Jerry Brown (1975-1983, 2011-Present), Jerry Brown’s father (1959-1967), and Jerry Brown’s Chief of Staff (1999-2003).

California Lawmaker 2021

Now Available on Amazon

Recent Posts

  • Mike McGuire to be California’s next Senate pro Tem August 29, 2023
  • 2011 Senate District to Assembly District Conversion Table (2012-2024) August 14, 2023
  • State Medals February 7, 2023
  • What Happened in the 2022 Election November 13, 2022

Copyright © 2023 · Education Pro on Genesis Framework · WordPress · Log in